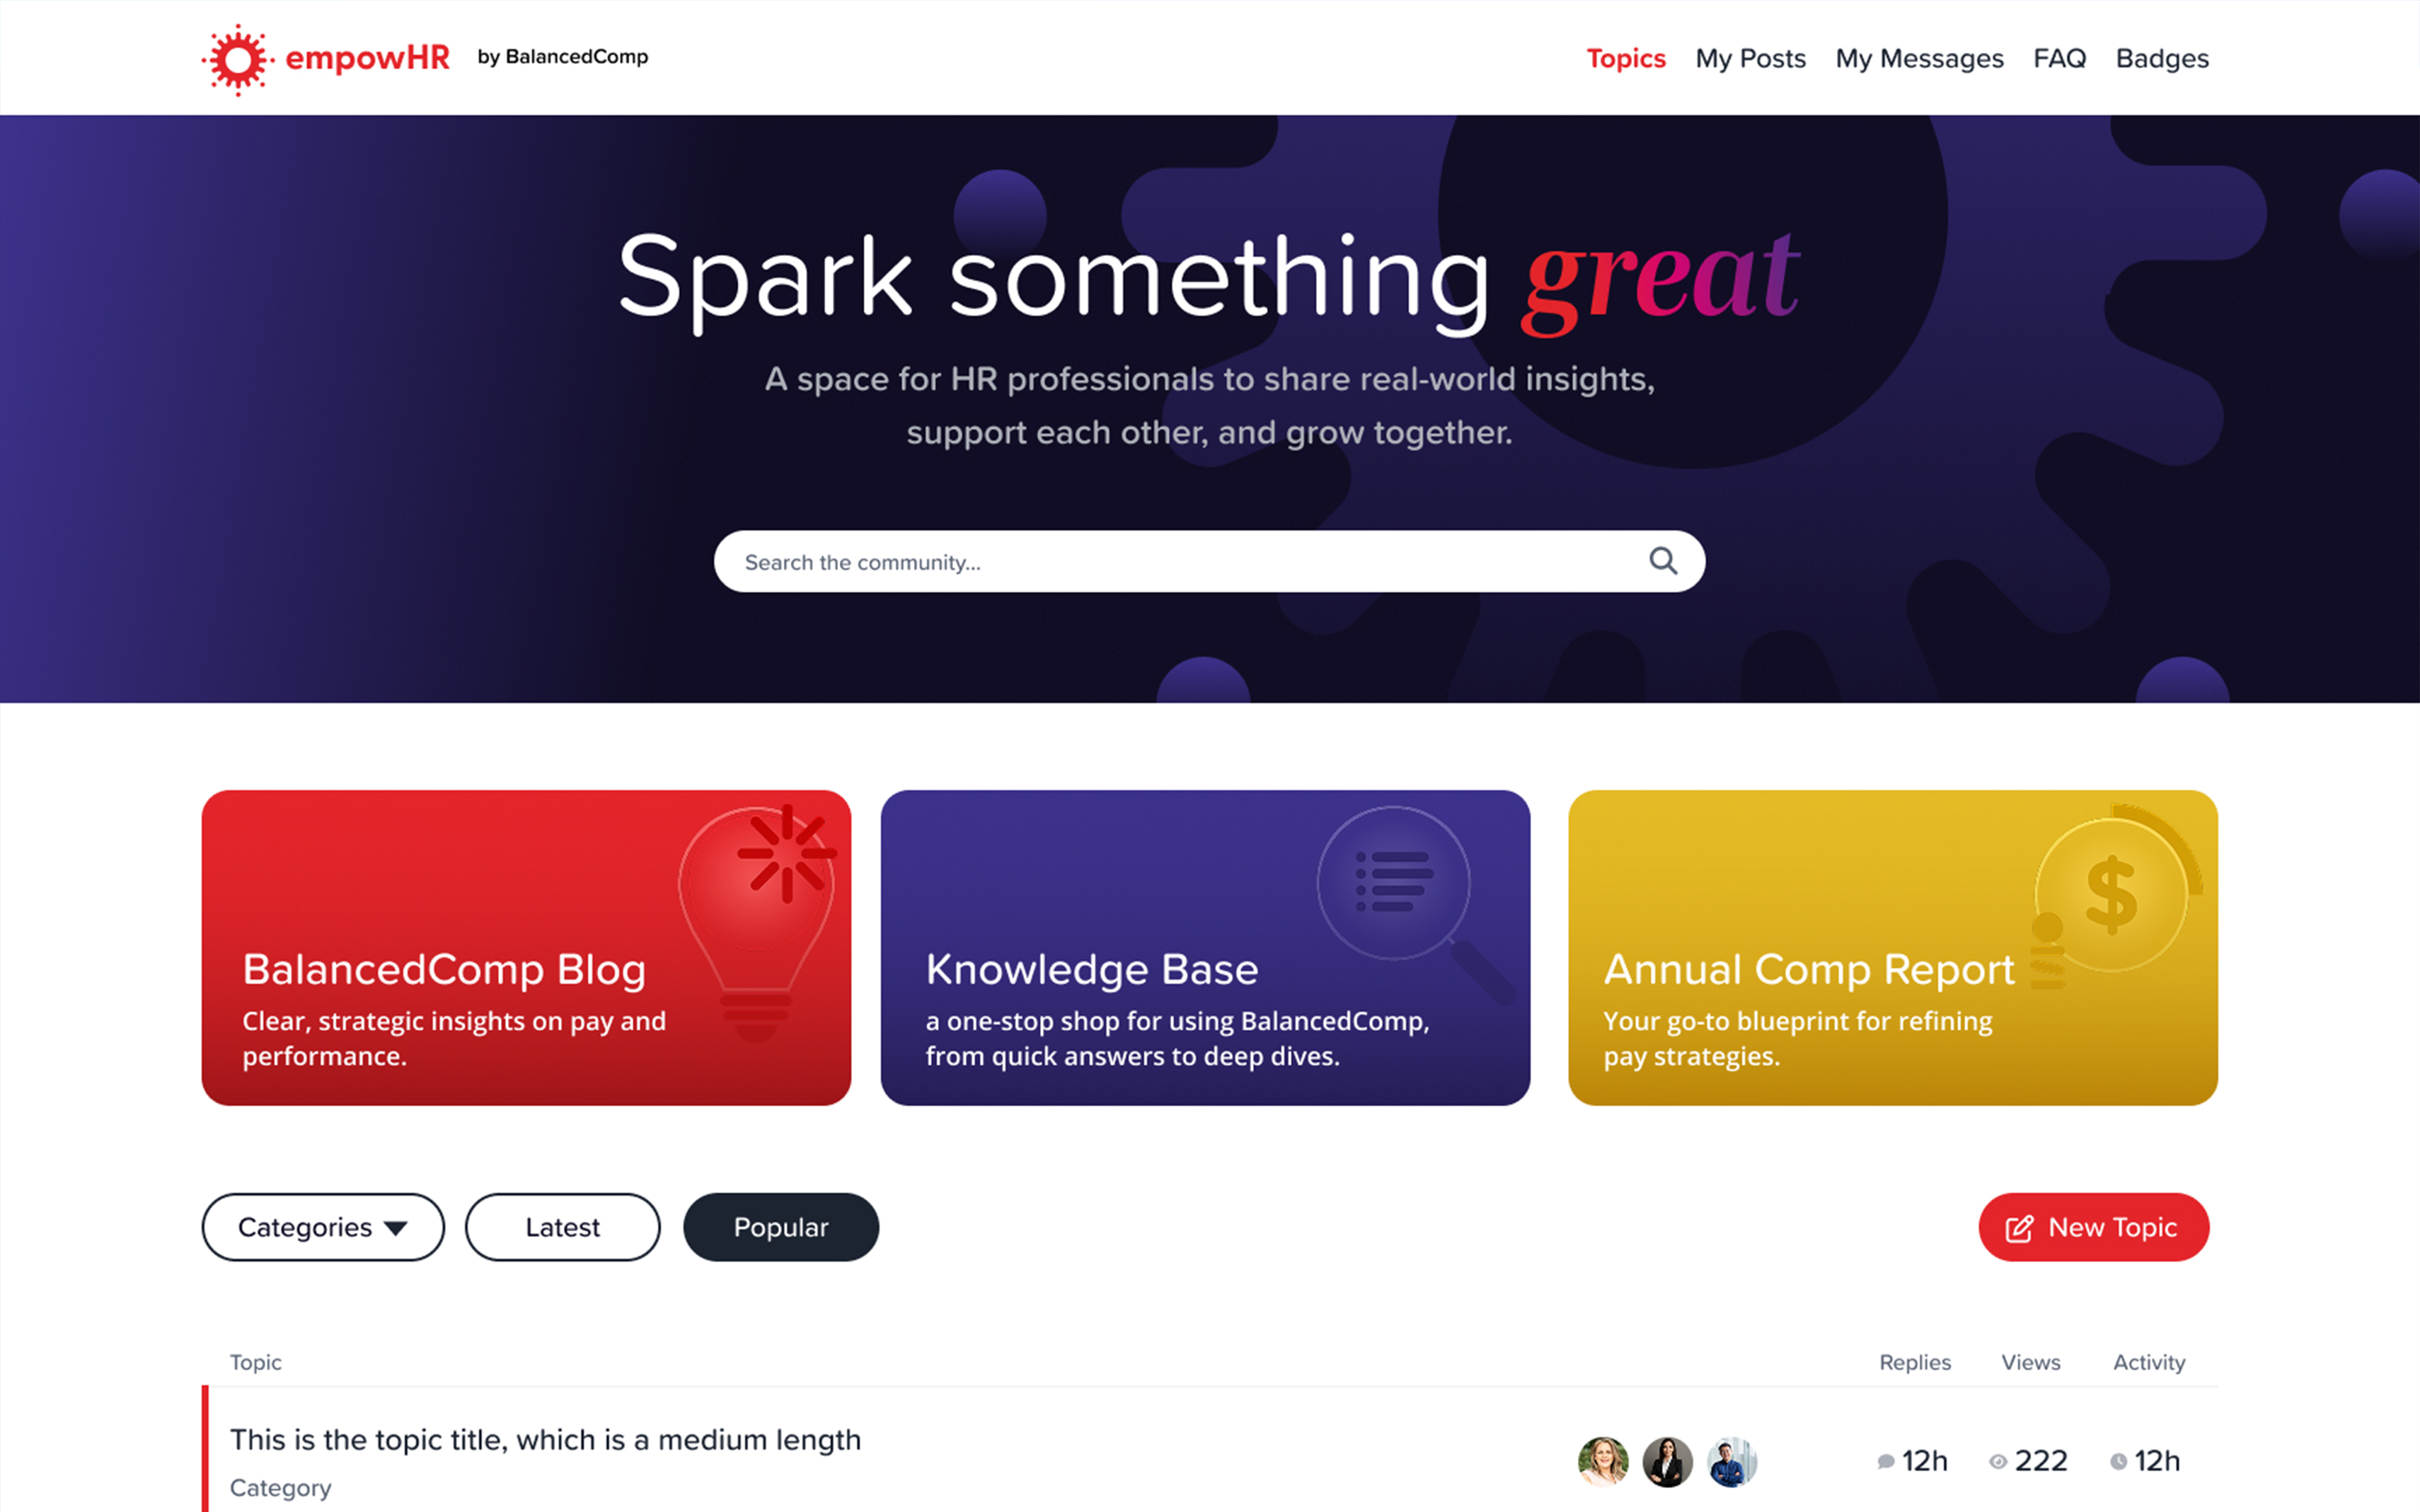
Our success starts with the people who make it happen
Average support happiness score
96.9%
Average BalancedComp tenure
7.4 Years
Slack messages sent
78,352
Average Wordle score
3.8
Total years of consultant & comp team experience
134 Years
BalancedComp's 2025-2026 Annual Comp Report helps you fine-tune pay strategies for a changing financial landscape. Inside, you'll find the latest trends and compensation insights designed to help HR professionals and executives make data-driven decisions with confidence. You'll also get a closer look at the people and culture behind BalancedComp—the team making data work for people.
Human Resources is continually steering a ship through choppy water. There is a tight labor market, inflation is nibbling at margins, and more economic fog is expected on the horizon. And now, it includes a flatlining salary increase budget.
Each year brings new goals and new ways to reward performance.
This report shows how your incentive plans compare across the
banking industry. With average and median incentive pay for
more than 50 benchmark positions by asset size, it helps you
design programs that drive performance and promote equity.
Use these percentages to assess last year’s results and set
targets that motivate and retain top talent. BalancedComp
clients can also upload these percentages as market incentives
for their positions to analyze Total Cash Compensation
Comparison (wages + incentive) / (midpoint + market
incentive).
Setting new goals means finding better ways to reward
performance. This report shows how your incentive plans
compare across the credit union industry. With average and
median incentive pay for more than 45 benchmark positions by
asset size, it helps you design programs that drive
performance and promote equity.
Use these percentages to assess last year’s results and set
targets that motivate and retain top talent. BalancedComp
clients can also upload these percentages as market incentives
for their positions to analyze Total Cash Compensation
Comparison (wages + incentive) / (midpoint + market
incentive).
Understanding how your teams stack up against peers is key to
effective workforce planning. This report provides the only
nationally available data comparing department headcounts across
financial institutions, including average team sizes, direct
reports to the CEO, and supervisor ratios.
Use these benchmarks to evaluate staffing levels and guide next
year’s workforce strategy with confidence.
Equitable pay is essential to building a strong organization.
This report evaluates average compa ratios for minority and
non-minority employees across all asset sizes for banks and
credit unions, offering a national perspective on pay equity
in the financial industry.
Use these benchmarks to uncover disparities, measure progress,
and ensure fair pay compliance. With this data, your team can
make informed adjustments that promote equity, transparency,
and long-term retention.
Fair pay starts with clear insight. This report evaluates
average compa ratios for men, women, and non-binary employees
across all asset sizes for banks and credit unions, providing
a clear view of gender equity across the financial
industry.
Use these insights to compare pay practices to industry
standards, identify disparities, and strengthen compliance
with fair pay regulations. By understanding the data, you can
adjust compensation with confidence, improving transparency,
equity, and employee trust.
Your HR team keeps your organization running smoothly. This
report provides average HR salaries by asset size, covering
key positions such as Top HR Executive, HR Director, HR
Manager, Recruiter, HR Generalist, and HR Specialist.
Use this data to compare your HR team’s pay to industry
standards, ensure competitive compensation, and attract and
retain top talent within your HR department.
Employee retention tells the story of an organization’s
stability. This report shows how your turnover compares to
industry averages for your asset size, tracking trends from
2020 to today.
Use these insights to see how your retention rates align with
the market and identify opportunities to strengthen workforce
stability across your institution.
Understanding how leadership pay aligns with employee wages is
key to building a transparent and equitable workplace. This
report shows how CEO base pay compares to employee wages across
all asset sizes for banks and credit unions, offering a clear
view of industry averages.
Use these insights to evaluate executive compensation,
strengthen pay equity, and support a culture of fairness within
your organization.
96.9%
7.4 Years
78,352
3.8
134 Years
6.15
9,915
2,270
99.94%
73,302
The BalancedComp app comes with job descriptions for more than 300 industry positions, which you can modify and incorporate when building your own.
Our team's goal is to make your day easier, more productive, and maybe even a little more fun. Here's your exclusive look at the most exciting updates of the year—each designed to supercharge your experience.
This year's symposium was a powerhouse of inspiration,
equipping HR professionals with cutting-edge tools to lead
with confidence, navigate economic challenges, and
revolutionize compensation strategies in a dynamic
industry.
The energy was palpable, the insights were transformative,
and the connections forged will shape the future of HR
leadership.
financial institutions
wage differentials
benchmark positions
Over 300 banks and credit unions across the US pay and evaluate their employees using the BalancedComp suite of products.